JavaFX ScatterChart散点图

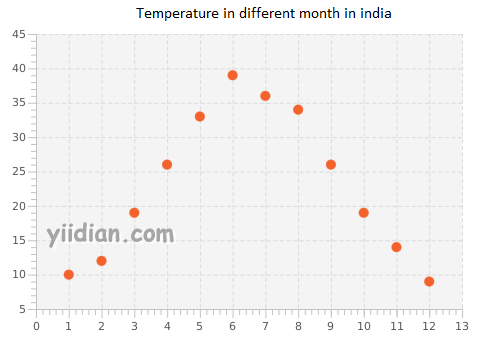
在散点图中,数据点沿图形分散。每个数据点显示两个轴之间的映射。它主要用于绘制轴之间的关系。如下图所示,显示了一年中的温度变化。在 X 轴上绘制月份数,而在 Y 轴上绘制温度(以摄氏度为单位)。
在 JavaFX 中,散点图由类 javafx.scene.chart.ScatterChart 类表示。我们需要实例化这个类以创建散点图。
1 ScatterChart类的构造函数
该类包含下面给出的两个构造函数。
- public ScatterChart(Axis Xaxis, Axis Yaxis)
: - public ScatterChart(Axis Xaxis, Axis Yaxis, ObservableListdata)
2 ScatterChart类的例子
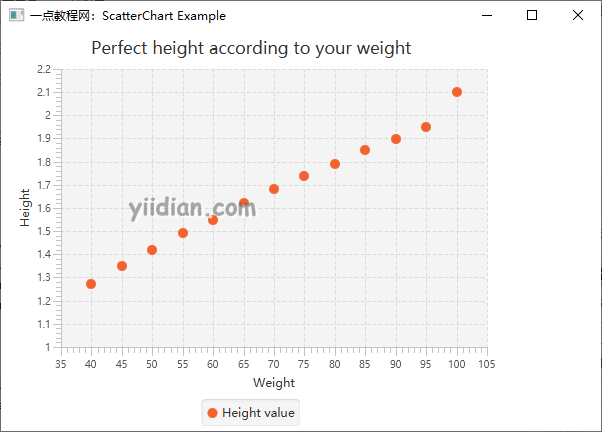
在下面的例子中,我们根据人的体重显示了完美的身高。图表中显示的数据在逻辑上是正确的。
package com.yiidian;

import javafx.application.Application;
import javafx.scene.Group;
import javafx.scene.Scene;
import javafx.scene.chart.NumberAxis;
import javafx.scene.chart.ScatterChart;
import javafx.scene.chart.XYChart;
import javafx.stage.Stage;

public class ScatterChartExample extends Application {

    @Override
    public void start(Stage primaryStage) throws Exception {
        //Configuring Xaxis and Yaxis
        NumberAxis xaxis = new NumberAxis(35,105,5);
        NumberAxis yaxis = new NumberAxis(1,2.2,0.1);
        xaxis.setLabel("Weight");
        yaxis.setLabel("Height");

        //Configuring ScatterChart
        ScatterChart s = new ScatterChart(xaxis,yaxis);
        s.setTitle("Perfect height according to your weight");

        //Configuring Series and adding data to the series
        XYChart.Series series = new XYChart.Series();
        series.setName("Height value");
        series.getData().add(new XYChart.Data(40,1.27));
        series.getData().add(new XYChart.Data(45,1.35));
        series.getData().add(new XYChart.Data(50,1.42));
        series.getData().add(new XYChart.Data(55,1.49));
        series.getData().add(new XYChart.Data(60,1.55));
        series.getData().add(new XYChart.Data(65,1.62));
        series.getData().add(new XYChart.Data(70,1.68));
        series.getData().add(new XYChart.Data(75,1.74));
        series.getData().add(new XYChart.Data(80,1.79));
        series.getData().add(new XYChart.Data(85,1.85));
        series.getData().add(new XYChart.Data(90,1.90));
        series.getData().add(new XYChart.Data(95,1.95));
        series.getData().add(new XYChart.Data(100,2.1));

        //Adding series to the ScatterChart
        s.getData().add(series);

        //Configuring group and Scene
        Group root = new Group();
        root.getChildren().add(s);
        Scene scene = new Scene(root,600,400);
        primaryStage.setScene(scene);
        primaryStage.setTitle("一点教程网:ScatterChart Example");
        primaryStage.show();


    }
    public static void main(String[] args) {
        launch(args);
    }

}
输出结果为:
热门文章
优秀文章
