JavaFX PieChrt饼图

通常,饼图是一种图形或图表,其中圆圈的扇区用于表示整个信息的不同比例。扇形弧的角度根据扇形所代表的信息百分比而变化。
在下图中,显示了一个饼图,其扇形代表一个人在篮子里的水果数量。

1 PieChrt类的属性
| 属性 | 描述 | setter方法 |
|---|---|---|
| clockwise | 它是一个布尔类型的属性。它的真值意味着切片从起始角度顺时针放置。 | setClockWise(Boolean value) |
| data | 它是一个可观察的 List 类型属性。它表示要在饼图中设置的数据。类PieChart.Data用于处理数据到饼图切片的分配。 | setData(PieChart.Data value) |
| labelLineLength | 它是一个双重类型的属性。它表示从饼图外部到切片标签的线的长度。 | setLabelLineLength(double value) |
| labelsVisible | 它是一个布尔类型的属性。它的真值意味着将绘制饼图切片标签。 | setLabelsVisible(boolean value) |
| startAngle | 它是一个双重类型的属性。它表示第一个饼图切片的角度。 | setStartAngle(double value) |
2 PieChrt类的构造函数
该类包含下面给出的两个构造函数。
- public PieChart() :创建一个空 PieChart 的新实例。
- public PieChart(ObservableList data)
: 使用指定的数据切片创建饼图的新实例。
3 PieChrt类的例子1
package com.yiidian;
import javafx.application.Application;
import javafx.collections.FXCollections;
import javafx.collections.ObservableList;
import javafx.scene.Scene;
import javafx.scene.chart.PieChart;
import javafx.scene.layout.StackPane;
import javafx.stage.Stage;
public class ChartTest extends Application {
public static void main(String[] args) {
launch(args);
}
@Override
public void start(Stage primaryStage) throws Exception {
// TODO Auto-generated method stub
//Instantiating the pie-chart class
PieChart piechart = new PieChart();
//setting the data of the pie chart.
piechart.setData(getChartData());
//Creating Layout
StackPane root = new StackPane();
//Adding pie-chart to the layout
root.getChildren().add(piechart);
//configuring scene
Scene scene = new Scene(root,400,400);
primaryStage.setScene(scene);
primaryStage.setTitle("一点教程网:PieChart Example");
primaryStage.show();
}
//creating getChartData method to set the chart data
private ObservableList<PieChart.Data> getChartData() {
ObservableList<PieChart.Data> list = FXCollections.observableArrayList();
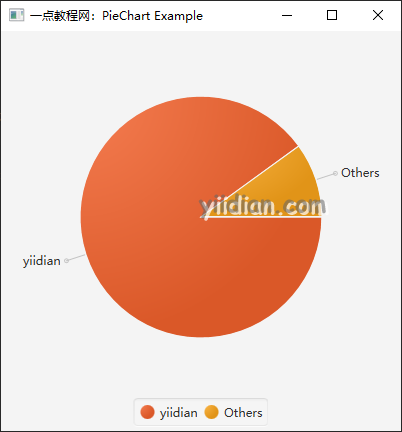
list.addAll(new PieChart.Data("yiidian", 90),
new PieChart.Data("Others", 10));
return list;
}
}
输出结果为:
4 PieChrt类的例子2
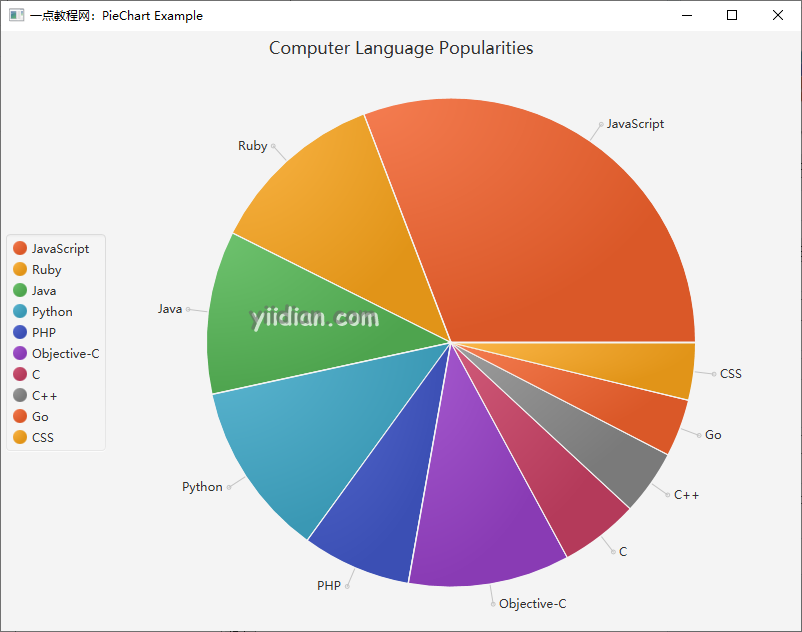
在下面的示例中,我们创建了一个饼图,显示了所有计算机编程语言的流行程度。
package com.yiidian;

import javafx.application.Application;
import javafx.collections.FXCollections;
import javafx.collections.ObservableList;
import javafx.geometry.Side;
import javafx.scene.Scene;
import javafx.scene.chart.PieChart;
import javafx.scene.layout.StackPane;
import javafx.stage.Stage;

public class ChartTest extends Application {
    public static void main(String[] args) {
        launch(args);
    }

    @Override
    public void start(Stage primaryStage) throws Exception {
        //Instantiating PieChart class
        PieChart piechart = new PieChart();

        //Setting pieChart data
        piechart.setData(getChartData());
        piechart.setLegendSide(Side.LEFT);
        piechart.setTitle("Computer Language Popularities");
        piechart.setClockwise(false);

        //Creating layout
        StackPane root = new StackPane();

        //Adding piechart to the layout
        root.getChildren().add(piechart);

        //Configuring Scene and stage object
        Scene scene = new Scene(root,800,600);
        primaryStage.setScene(scene);
        primaryStage.setTitle("一点教程网:PieChart Example");
        primaryStage.show();

    }

    //The method sets the data to the pie-chart.
    private ObservableList<PieChart.Data> getChartData() {
        ObservableList<PieChart.Data> list = FXCollections.observableArrayList();
        list.addAll(new PieChart.Data("JavaScript", 30.8),
                new PieChart.Data("Ruby", 11.8),
                new PieChart.Data("Java", 10.8),
                new PieChart.Data("Python", 11.6),
                new PieChart.Data("PHP", 7.2),
                new PieChart.Data("Objective-C", 10.7),
                new PieChart.Data("C", 5.2),
                    new PieChart.Data("C++", 4.3),
                        new PieChart.Data("Go",3.8),
                        new PieChart.Data("CSS", 3.8)
    );
        return list;
    }
}
输出结果为:
热门文章
优秀文章
