JavaFX StackedAreaChart堆积面积图

堆叠面积图是基本面积图的扩展,其中显示同一图形上几个组的值的演变。该区域是针对某个组的所有数据点绘制的。然而,不同组的区域以堆叠的形式显示,但它们彼此不重叠。堆积面积图主要用于追踪两组数值的比较。
在下图中,显示了不同州的人口。男性和女性人口由两个不同的区域表示,其中代表女性人口的区域绘制在代表女性人口的区域上。在 X 轴上绘制了一些州,而在 Y 轴上绘制了人口(以千万计)。

在 JavaFX 中,类javafx.scene.chart.StackedAreaChart用于表示堆积面积图。我们需要实例化这个类以生成一个 Stacked-Area-Chart 节点。
1 StackedAreaChart类的属性
| 属性 | 描述 | setter方法 |
|---|---|---|
| createSymbols | 它是一个布尔类型的属性。它的真值表示将为尚未为其创建符号的任何数据项创建 CSS 符号。 | setCreateSymbols(boolean value) |
2 StackedAreaChart类的构造函数
该类包含下面给出的两个构造函数。
- public StackedAreaChart(Axis Xaxis, Axis Yaxis)
: - public StackedAreaChart(Axis Xaxis, Axis Yaxis, ObservableList> data))
3 StackedAreaChart类的例子
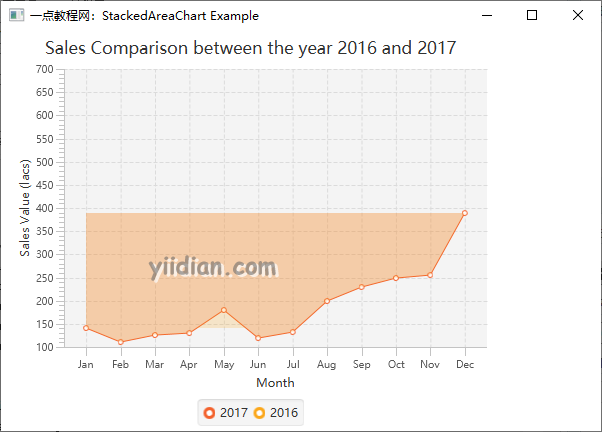
在以下示例中,我们展示了一家公司在两个不同年份的销售额之间的比较。
package com.yiidian;

import javafx.application.Application;
import javafx.scene.Group;
import javafx.scene.Scene;
import javafx.scene.chart.CategoryAxis;
import javafx.scene.chart.NumberAxis;
import javafx.scene.chart.StackedAreaChart;
import javafx.scene.chart.XYChart;
import javafx.stage.Stage;

public class StackedAreaChartExample extends Application {
    @Override
    public void start(Stage primaryStage) throws Exception {
        // Configuring Xaxis and Yaxis
        CategoryAxis xaxis = new CategoryAxis();
        NumberAxis yaxis = new NumberAxis(100,700,50);
        xaxis.setLabel("Month");
        yaxis.setLabel("Sales Value (lacs)");

        //Creating StackedAreaChart
        StackedAreaChart stack = new StackedAreaChart(xaxis,yaxis);
        stack.setTitle("Sales Comparison between the year 2016 and 2017");

        //Configuring Series 1
        XYChart.Series year1 = new XYChart.Series<>();
        year1.getData().add(new XYChart.Data("Jan",140));
        year1.getData().add(new XYChart.Data("Feb",110));
        year1.getData().add(new XYChart.Data("Mar",125));
        year1.getData().add(new XYChart.Data("Apr",130));
        year1.getData().add(new XYChart.Data("May",180));
        year1.getData().add(new XYChart.Data("Jun",120));
        year1.getData().add(new XYChart.Data("Jul",133));
        year1.getData().add(new XYChart.Data("Aug",200));
        year1.getData().add(new XYChart.Data("Sep",230));
        year1.getData().add(new XYChart.Data("Oct",250));
        year1.getData().add(new XYChart.Data("Nov",255));
        year1.getData().add(new XYChart.Data("Dec",390));

        //adding series1 to the stackedareachart
        stack.getData().add(year1);
        year1.setName("2017");

        //Configuring Series 2
        XYChart.Series year2 = new XYChart.Series<>();
        year2.getData().add(new XYChart.Data("Jan",200));
        year2.getData().add(new XYChart.Data("Feb",210));
        year2.getData().add(new XYChart.Data("Mar",225));
        year2.getData().add(new XYChart.Data("Apr",430));
        year2.getData().add(new XYChart.Data("May",180));
        year2.getData().add(new XYChart.Data("Jun",334));
        year2.getData().add(new XYChart.Data("Jul",143));
        year2.getData().add(new XYChart.Data("Aug",400));
        year2.getData().add(new XYChart.Data("Sep",431));
        year2.getData().add(new XYChart.Data("Oct",359));
        year2.getData().add(new XYChart.Data("Nov",155));
        year2.getData().add(new XYChart.Data("Dec",190));

        //Adding Series2 to the StackedAreaChart
        stack.getData().add(year2);
        year2.setName("2016");


        //Configuring group and Scene
        Group root = new Group();
        root.getChildren().add(stack);
        Scene scene = new Scene(root,600,400);
        primaryStage.setScene(scene);
        primaryStage.setTitle("一点教程网:StackedAreaChart Example");
        primaryStage.show();

    }
    public static void main(String[] args) {
        launch(args);
    }
}
输出结果为:
热门文章
优秀文章
