GWT Highcharts 树状图

GWT Highcharts 基树状图 介绍
我们已经在《GWT Highcharts 入门案例》一章中看到了用于绘制此图表的步骤。现在让我们考虑以下示例以进一步了解树状图。
series
将图表类型配置为基于“树状图”。series.type决定图表的系列类型。此处,默认值为“line”。
series.setType(Type.TREEMAP);
GWT Highcharts 树状图 示例
package com.yiidian.helloWorld.client;


import com.google.gwt.core.client.EntryPoint;
import com.google.gwt.user.client.ui.RootPanel;
import org.moxieapps.gwt.highcharts.client.*;
import org.moxieapps.gwt.highcharts.client.labels.DataLabels;
import org.moxieapps.gwt.highcharts.client.labels.DataLabelsData;
import org.moxieapps.gwt.highcharts.client.labels.DataLabelsFormatter;
import org.moxieapps.gwt.highcharts.client.labels.PieDataLabels;
import org.moxieapps.gwt.highcharts.client.plotOptions.*;


public class HelloWorld implements EntryPoint {
    public void onModuleLoad() {
        final Chart chart = new Chart()
                .setChartTitleText("Fruit Consumption");

        //Defining points to act as parents
        final Point  appleParent = new Point("Apples")
                .setColor("#EC2500");
        final Point bananaParent = new Point("Bananas")
                .setColor("#ECE100");
        final Point orangeParent = new Point("Oranges")
                .setColor("#EC9800");

        chart.addSeries(chart.createSeries()
                .setType(Series.Type.TREEMAP)
                .setPoints(new Point[]{
                        appleParent,
                        bananaParent,
                        orangeParent,
                        new Point("Anne", 5)
                                .setParent(appleParent),
                        new Point("Rick", 3)
                                .setParent(appleParent),
                        new Point("Peter", 4)
                                .setParent(appleParent),
                        new Point("Anne", 4)
                                .setParent(bananaParent),
                        new Point("Rick", 10)
                                .setParent(bananaParent),
                        new Point("Peter", 1)
                                .setParent(bananaParent),
                        new Point("Anne", 1)
                                .setParent(orangeParent),
                        new Point("Rick", 3)
                                .setParent(orangeParent),
                        new Point("Peter", 3)
                                .setParent(orangeParent),
                        new Point("Susanne", 2)
                                .setParent("Kiwi")
                                .setColor("#9EDE00")
                })
        );
        RootPanel.get().add(chart);
    }
}
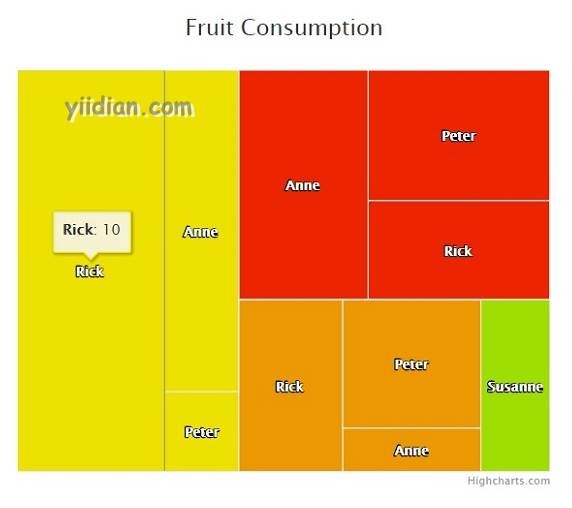
输出结果为:
热门文章
优秀文章
