GWT Highcharts 散点图

GWT Highcharts 散点图 介绍
我们已经在《GWT Highcharts 入门案例》一章中看到了用于绘制此图表的步骤。现在让我们考虑以下示例以进一步了解散点图。
系列
将图表类型配置为基于散点图。series.type决定图表的系列类型。此处,默认值为“line”。
chart.addSeries(chart.createSeries()
   .setName("Observations")
   .setType(Type.SCATTER)
   .setPoints(new Number[] {
      1, 1.5, 2.8, 3.5, 3.9, 4.2
   })
);
GWT Highcharts 散点图 示例
package com.yiidian.helloWorld.client;
import com.google.gwt.core.client.EntryPoint;
import com.google.gwt.user.client.ui.RootPanel;
import org.moxieapps.gwt.highcharts.client.*;
import org.moxieapps.gwt.highcharts.client.labels.*;
import org.moxieapps.gwt.highcharts.client.plotOptions.*;
public class HelloWorld implements EntryPoint {
public void onModuleLoad() {
final Chart chart = new Chart()
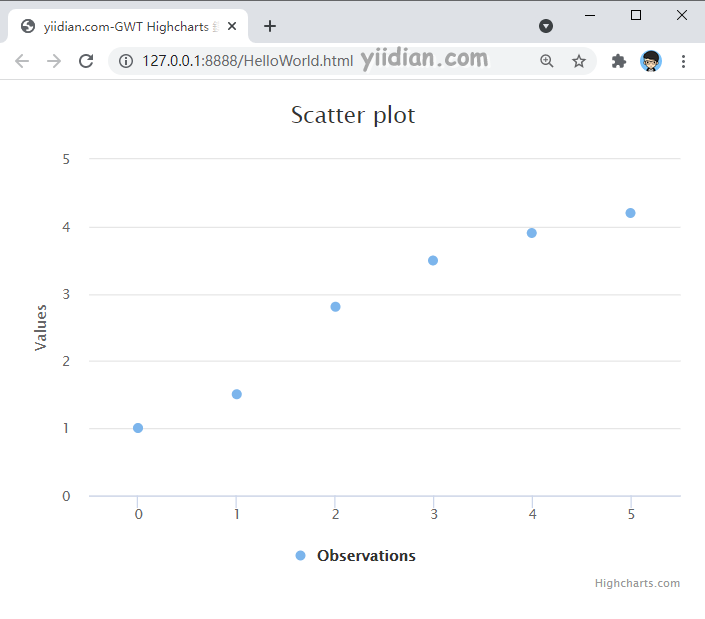
.setChartTitleText("Scatter plot");
chart.getXAxis()
.setMin(-0.5)
.setMax(5.5);
chart.getYAxis()
.setMin(0);
chart.addSeries(chart.createSeries()
.setName("Observations")
.setType(Series.Type.SCATTER)
.setPoints(new Number[] {
1, 1.5, 2.8, 3.5, 3.9, 4.2
})
);
RootPanel.get().add(chart);
}
}
输出结果为:
热门文章
优秀文章
