GWT Highcharts 时间序列可缩放的折线图

GWT Highcharts 时间序列可缩放的折线图 介绍
我们已经在《GWT Highcharts 入门案例》一章中看到了用于绘制此图表的步骤。现在让我们考虑以下示例以进一步了解时间序列可缩放的折线图。
GWT Highcharts 时间序列可缩放的折线图 示例
package com.yiidian.helloWorld.client;
import com.google.gwt.core.client.EntryPoint;
import com.google.gwt.i18n.client.DateTimeFormat;
import com.google.gwt.user.client.ui.RootPanel;
import org.moxieapps.gwt.highcharts.client.*;
import org.moxieapps.gwt.highcharts.client.labels.DataLabels;
import org.moxieapps.gwt.highcharts.client.plotOptions.AreaPlotOptions;
import org.moxieapps.gwt.highcharts.client.plotOptions.LinePlotOptions;
import org.moxieapps.gwt.highcharts.client.plotOptions.Marker;
public class HelloWorld implements EntryPoint {
public void onModuleLoad() {
Chart chart = new Chart()
.setZoomType(BaseChart.ZoomType.X)
.setSpacingRight(20)
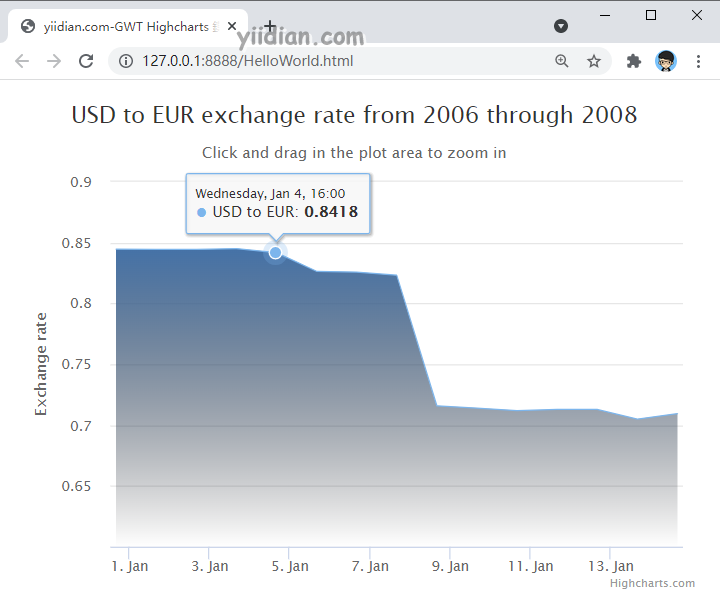
.setChartTitleText("USD to EUR exchange rate from 2006 through 2008")
.setChartSubtitleText("Click and drag in the plot area to zoom in")
.setLegend(new Legend()
.setEnabled(false))
.setToolTip(new ToolTip()
.setShared(true)
)
.setLegend(new Legend()
.setEnabled(false)
)
.setAreaPlotOptions(new AreaPlotOptions()
.setFillColor(new Color()
.setLinearGradient(0, 0, 0, 1)
.addColorStop(0, 69, 114, 167)
.addColorStop(1, 2, 0, 0, 0)
)
.setMarker(new Marker()
.setEnabled(false)
.setHoverState(new Marker()
.setEnabled(true)
.setRadius(5)
)
)
.setShadow(false)
.setHoverStateLineWidth(1)
);
chart.getXAxis()
.setType(Axis.Type.DATE_TIME)
.setMaxZoom(14 * 24 * 3600000) //fourteen days
.setAxisTitleText(null);
chart.getYAxis()
.setAxisTitleText("Exchange rate")
.setMin(0.6)
.setStartOnTick(false)
.setShowFirstLabel(false);
chart.addSeries(chart.createSeries()
.setType(Series.Type.AREA)
.setName("USD to EUR")
.setPlotOptions(new AreaPlotOptions()
.setPointInterval(24 * 3600 * 1000)
.setPointStart(getTime("2006-01-01"))
)
.setPoints(new Number[] {
0.8446, 0.8445, 0.8444, 0.8451, 0.8418, 0.8264, 0.8258, 0.8232,
0.7158, 0.714, 0.7119, 0.7129, 0.7129, 0.7049, 0.7095
})
);
RootPanel.get().add(chart);
}
private static final DateTimeFormat dateTimeFormat = DateTimeFormat.getFormat("yyyy-MM-dd");
private long getTime(String date) {
return dateTimeFormat.parse(date).getTime();
}
}
输出结果为:
热门文章
优秀文章
