GWT Highcharts 带数据标签的折线图

GWT Highcharts 带数据标签的折线图 介绍
我们已经在《GWT Highcharts 入门案例》一章中看到了用于绘制此图表的步骤。现在让我们考虑以下示例以进一步了解带数据标签的折线图。
GWT Highcharts 带数据标签的折线图 示例
package com.yiidian.helloWorld.client;
import com.google.gwt.core.client.EntryPoint;
import com.google.gwt.user.client.ui.RootPanel;
import org.moxieapps.gwt.highcharts.client.*;
import org.moxieapps.gwt.highcharts.client.labels.DataLabels;
import org.moxieapps.gwt.highcharts.client.plotOptions.LinePlotOptions;
public class HelloWorld implements EntryPoint {
public void onModuleLoad() {
Chart chart = new Chart()
.setType(Series.Type.LINE)
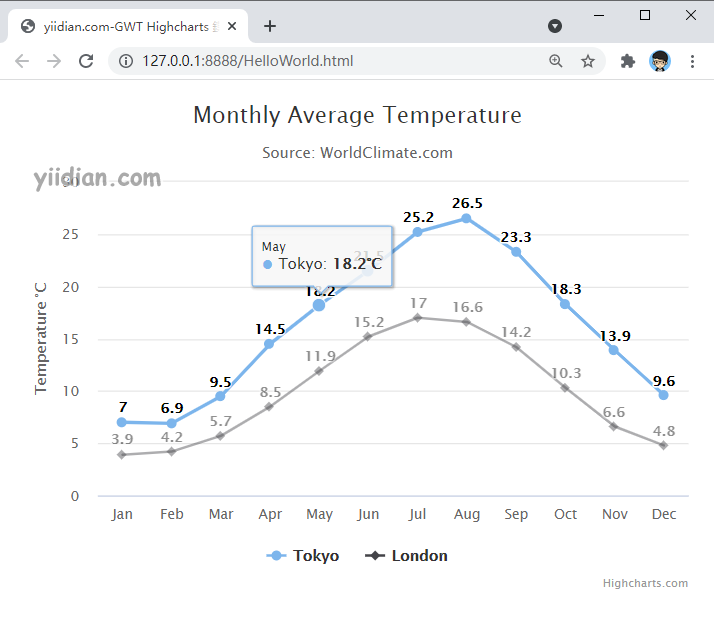
.setChartTitleText("Monthly Average Temperature")
.setChartSubtitleText("Source: WorldClimate.com");
XAxis xAxis = chart.getXAxis();
xAxis.setCategories("Jan", "Feb", "Mar", "Apr", "May", "Jun",
"Jul", "Aug", "Sep", "Oct", "Nov", "Dec");
YAxis yAxis = chart.getYAxis();
yAxis.setAxisTitleText("Temperature °C");
yAxis.createPlotLine()
.setValue(0)
.setWidth(1)
.setColor("#808080");
ToolTip toolTip = new ToolTip();
toolTip.setValueSuffix("°C");
chart.setToolTip(toolTip);
chart.setLinePlotOptions(new LinePlotOptions()
.setEnableMouseTracking(true)
.setDataLabels(new DataLabels()
.setEnabled(true)
)
);
chart.addSeries(chart.createSeries()
.setName("Tokyo")
.setPoints(new Number[] {
7.0, 6.9, 9.5, 14.5, 18.2, 21.5, 25.2,
26.5, 23.3, 18.3, 13.9, 9.6
})
);
chart.addSeries(chart.createSeries()
.setName("London")
.setPoints(new Number[] {
3.9, 4.2, 5.7, 8.5, 11.9, 15.2, 17.0,
16.6, 14.2, 10.3, 6.6, 4.8
})
);
RootPanel.get().add(chart);
}
}
输出结果为:
热门文章
优秀文章
