GWT Highcharts 带符号的折线图

GWT Highcharts 带符号的折线图 介绍

我们已经在《GWT Highcharts 入门案例》一章中看到了用于绘制此图表的步骤。现在让我们考虑以下示例以进一步了解带符号的折线图。

GWT Highcharts 带符号的折线图 示例

package com.yiidian.helloWorld.client;


import com.google.gwt.core.client.EntryPoint;
import com.google.gwt.i18n.client.DateTimeFormat;
import com.google.gwt.user.client.ui.RootPanel;
import org.moxieapps.gwt.highcharts.client.*;
import org.moxieapps.gwt.highcharts.client.labels.*;
import org.moxieapps.gwt.highcharts.client.plotOptions.AreaPlotOptions;
import org.moxieapps.gwt.highcharts.client.plotOptions.LinePlotOptions;
import org.moxieapps.gwt.highcharts.client.plotOptions.Marker;
import org.moxieapps.gwt.highcharts.client.plotOptions.SplinePlotOptions;

public class HelloWorld implements EntryPoint {
    public void onModuleLoad() {
        Chart chart = new Chart()
                .setType(Series.Type.SPLINE)
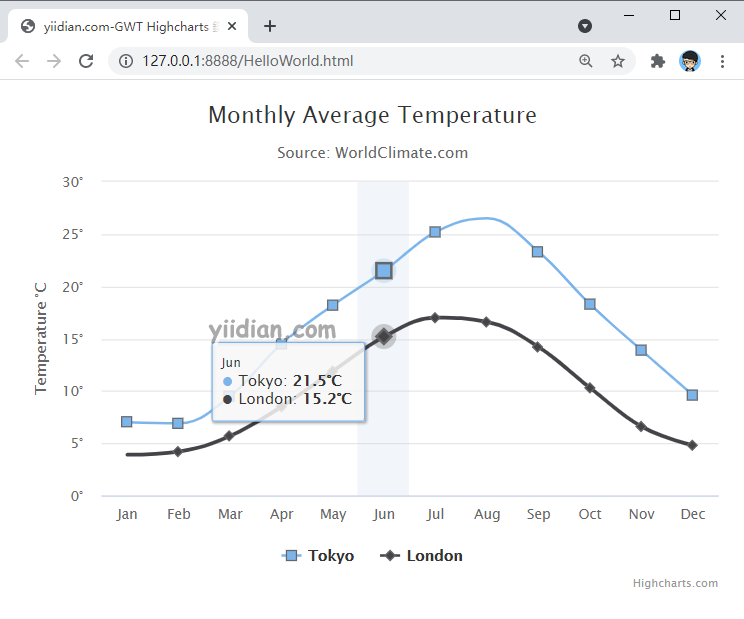
                .setChartTitleText("Monthly Average Temperature")
                .setChartSubtitleText("Source: WorldClimate.com");

        XAxis xAxis = chart.getXAxis();
        xAxis.setCategories("Jan", "Feb", "Mar", "Apr", "May", "Jun",
                "Jul", "Aug", "Sep", "Oct", "Nov", "Dec");

        YAxis yAxis = chart.getYAxis();
        yAxis.setAxisTitleText("Temperature °C");
        yAxis.setLabels(
                new YAxisLabels()
                        .setFormatter(new AxisLabelsFormatter() {
                            @Override
                            public String format(AxisLabelsData axisLabelsData) {
                                return axisLabelsData.getValueAsLong() + "°";
                            }
                        })
        );

        ToolTip toolTip = new ToolTip();
        toolTip.setValueSuffix("°C")
                .setCrosshairs(true)
                .setShared(true);

        chart.setToolTip(toolTip);

        chart.setSplinePlotOptions(new SplinePlotOptions()
                .setMarker(
                        new Marker()
                                .setRadius(4)
                                .setLineColor("#666666")
                                .setLineWidth(1)
                )
        );

        chart.addSeries(
                chart.createSeries()
                        .setName("Tokyo")
                        .setPlotOptions(
                                new SplinePlotOptions()
                                        .setMarker(
                                                new Marker()
                                                        .setSymbol(Marker.Symbol.SQUARE)
                                        )
                        )
                        .setPoints(
                                new Point[]{
                                        new Point(7.0),
                                        new Point(6.9),
                                        new Point(9.5),
                                        new Point(14.5),
                                        new Point(18.2),
                                        new Point(21.5),
                                        new Point(25.2),
                                        new Point(26.5)
                                                .setMarker(
                                                new Marker()
                                                        .setSymbol("http://highcharts.com/demo/gfx/sun.png")
                                        ),
                                        new Point(23.3),
                                        new Point(18.3),
                                        new Point(13.9),
                                        new Point(9.6)
                                }
                        )
        );

        chart.addSeries(
                chart.createSeries()
                        .setName("London")
                        .setPlotOptions(
                                new SplinePlotOptions()
                                        .setMarker(
                                                new Marker()
                                                        .setSymbol(Marker.Symbol.DIAMOND)
                                        )
                        )
                        .setPoints(
                                new Point[]{
                                        new Point(3.9)
                                                .setMarker(
                                                new Marker()
                                                        .setSymbol("http://highcharts.com/demo/gfx/snow.png")
                                        ),
                                        new Point(4.2),
                                        new Point(5.7),
                                        new Point(8.5),
                                        new Point(11.9),
                                        new Point(15.2),
                                        new Point(17.0),
                                        new Point(16.6),
                                        new Point(14.2),
                                        new Point(10.3),
                                        new Point(6.6),
                                        new Point(4.8),
                                }
                        )
        );
        RootPanel.get().add(chart);
    }
}

输出结果为:

热门文章

优秀文章