
创建仪表的代码段
private Chart gauge(Number newValue, String tooltip) {

    final Chart chart = new Chart();
    final Configuration configuration = chart.getConfiguration();
    configuration.getChart().setType(ChartType.GAUGE);
    configuration.getChart().setAlignTicks(false);
    configuration.getChart().setWidth(200);
    configuration.getChart().setHeight(200);
    configuration.getChart().setSpacingTop(0);
    configuration.getTitle().setMargin(0);
    configuration.getChart().setPlotBackgroundColor(SolidColor.GREENYELLOW);
    configuration.getChart().setPlotBackgroundImage(null);
    configuration.getChart().setPlotBorderWidth(0);
    configuration.getChart().setPlotShadow(false);
    configuration.getChart().setBackgroundColor(null);
    configuration.getChart().setMarginTop(0);
    configuration.getChart().setMarginBottom(0);

    configuration.getPane().setStartAngle(-150);
    configuration.getPane().setEndAngle(150);

    YAxis yAxis = new YAxis();
    // The limits are mandatory
    yAxis.setMin(0);
    yAxis.setMax(100);

    // Other configuration
    yAxis.getLabels().setStep(1);
    yAxis.setTickInterval(10);
    yAxis.setPlotBands(new PlotBand[] { new PlotBand(0, 40, SolidColor.GREEN),
            new PlotBand(40, 80, SolidColor.YELLOW), new PlotBand(80, 100, SolidColor.RED) });

    configuration.addyAxis(yAxis);

    final ListSeries series = new ListSeries(tooltip, 80);

    PlotOptionsGauge plotOptionsGauge = new PlotOptionsGauge();
    plotOptionsGauge.setDataLabels(new DataLabels());
    // plotOptionsGauge.getDataLabels()
    // .setFormatter("function() {return '<span style=\"color:#339\">'+
    // this.y + ' %</span>';}");

    plotOptionsGauge.setTooltip(new SeriesTooltip());
    plotOptionsGauge.getTooltip().setValueSuffix(" %");
    series.setPlotOptions(plotOptionsGauge);

    configuration.setSeries(series);

    series.updatePoint(0, newValue);

    chart.drawChart();

    return chart;
}
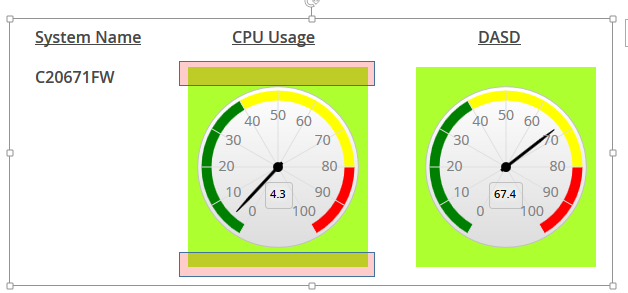
有关如何删除多余空间的任何指示???
TIA
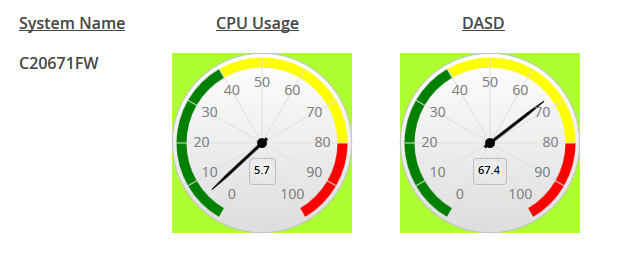
经过多次尝试,终于找到了解决方案。在仪表中添加以下行对我有用,下面是结果的快照
configuration.getPane().setSize(95, Unit.PERCENTAGE);
我发现将标题设置为浮动有帮助,因为这样绘图计算就不会考虑标题:
yourchart.getConfiguration().getTitle().setFloating(true);
您是否尝试过减小间距?
大多数 highcharts API 调用都可以与 vaadin-charts 一起使用:
https://api.highcharts.com/highcharts/chart.spacing
间距:数组。
自 3.0.6 起
图表外边缘和内容(如标题或图例,或轴标题和标签,如果有)之间的距离。数组中的数字分别表示顶部、右侧、底部和左侧。使用spacingTop、spacingRight、spacingBottom和spacingLeft选项对一个选项进行快速设置。
默认为[10,10,15,10]。
