GWT Highcharts 带有双轴、线、柱状的图表

GWT Highcharts 带有双轴、线、柱状的图表 介绍
我们已经在《GWT Highcharts 入门案例》一章中看到了用于绘制此图表的步骤。现在让我们考虑以下示例以进一步了解带有双轴、线、柱状的图表。
YAxis
使用 chart.getYAxis(index) 方法获取多个 yAxis。
chart.getYAxis(0);
chart.getYAxis(1);
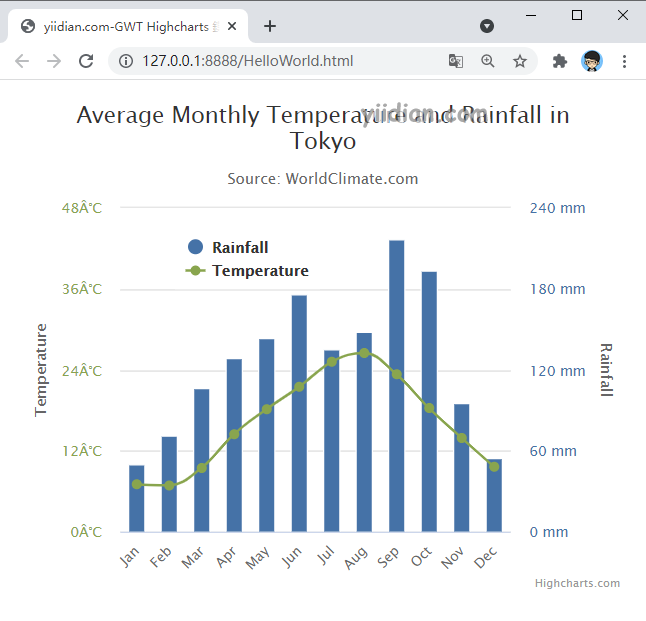
GWT Highcharts 带有双轴、线、柱状的图表 示例
package com.yiidian.helloWorld.client;


import com.google.gwt.core.client.EntryPoint;
import com.google.gwt.i18n.client.DateTimeFormat;
import com.google.gwt.i18n.client.NumberFormat;
import com.google.gwt.user.client.Random;
import com.google.gwt.user.client.Timer;
import com.google.gwt.user.client.ui.RootPanel;
import org.moxieapps.gwt.highcharts.client.*;
import org.moxieapps.gwt.highcharts.client.events.ChartClickEvent;
import org.moxieapps.gwt.highcharts.client.events.ChartClickEventHandler;
import org.moxieapps.gwt.highcharts.client.events.PointClickEvent;
import org.moxieapps.gwt.highcharts.client.events.PointClickEventHandler;
import org.moxieapps.gwt.highcharts.client.labels.*;
import org.moxieapps.gwt.highcharts.client.plotOptions.*;

import java.util.Date;

public class HelloWorld implements EntryPoint {
    public void onModuleLoad() {
        final Chart chart = new Chart()
                .setChartTitleText("Average Monthly Temperature and Rainfall in Tokyo")
                .setChartSubtitleText("Source: WorldClimate.com")
                .setToolTip(new ToolTip()
                        .setFormatter(new ToolTipFormatter() {
                            @Override
                            public String format(ToolTipData toolTipData) {
                                return toolTipData.getXAsString() + ": " + toolTipData.getYAsDouble() +
                                        ("Rainfall".equals(toolTipData.getSeriesName()) ? " mm" : "°C");
                            }
                        })
                )
                .setLegend(new Legend()
                        .setLayout(Legend.Layout.VERTICAL)
                        .setAlign(Legend.Align.LEFT)
                        .setVerticalAlign(Legend.VerticalAlign.TOP)
                        .setX(120)
                        .setY(100)
                        .setFloating(true)
                        .setBackgroundColor("#FFFFFF")
                );
        chart.getXAxis()
                .setCategories("Jan", "Feb", "Mar", "Apr", "May", "Jun",
                        "Jul", "Aug", "Sep", "Oct", "Nov", "Dec"  );

        // Primary yAxis
        chart.getYAxis(0)
                .setAxisTitle(new AxisTitle()
                        .setText("Temperature")
                )
                .setLabels(new YAxisLabels()
                        .setStyle(new Style()
                                .setColor("#89A54E")
                        )
                        .setFormatter(new AxisLabelsFormatter() {
                            @Override
                            public String format(AxisLabelsData axisLabelsData) {
                                return axisLabelsData.getValueAsLong() + "°C";
                            }
                        })
                );

        // Secondary yAxis
        chart.getYAxis(1)
                .setAxisTitle(new AxisTitle()
                        .setText("Rainfall")
                )
                .setOpposite(true)
                .setLabels(new YAxisLabels()
                        .setStyle(new Style()
                                .setColor("#4572A7")
                        )
                        .setFormatter(new AxisLabelsFormatter() {
                            @Override
                            public String format(AxisLabelsData axisLabelsData) {
                                return axisLabelsData.getValueAsLong() + " mm";
                            }
                        })
                );

        chart.addSeries(chart.createSeries()
                .setName("Rainfall")
                .setType(Series.Type.COLUMN)
                .setPlotOptions(new ColumnPlotOptions()
                        .setColor("#4572A7")
                )
                .setYAxis(1)
                .setPoints(new Number[]{
                        49.9, 71.5, 106.4, 129.2, 144.0, 176.0, 135.6, 148.5, 216.4, 194.1, 95.6, 54.4
                })
        );
        chart.addSeries(chart.createSeries()
                .setName("Temperature")
                .setType(Series.Type.SPLINE)
                .setPlotOptions(new SplinePlotOptions()
                        .setColor("#89A54E")
                )
                .setPoints(new Number[]{
                        7.0, 6.9, 9.5, 14.5, 18.2, 21.5, 25.2, 26.5, 23.3, 18.3, 13.9, 9.6
                })
        );
        RootPanel.get().add(chart);
    }
}
输出结果为:
热门文章
优秀文章
