GWT Highcharts 堆积分组柱状图

GWT Highcharts 堆积分组柱状图 介绍
我们已经在《GWT Highcharts 入门案例》一章中看到了用于绘制此图表的步骤。现在让我们考虑以下示例以进一步了解堆积分组柱状图。
绘图选项
plotOptions 是每个系列类型的配置对象的包装对象。每个系列的配置对象也可以被系列数组中给定的每个系列项目覆盖。这是为了将每个系列的值堆叠在一起。这是为了将每个系列的值堆叠在一起。
使用 plotOptions.column.stacking 将图表的堆叠配置为“normal”。可能的值为 null 禁用堆叠,“normal”按值堆叠,“percent”按百分比堆叠图表。
chart.setColumnPlotOptions(new ColumnPlotOptions()
   .setStacking(Stacking.NORMAL)
);
系列
配置每个系列的堆栈以标识系列的组。
chart.addSeries(chart.createSeries()
   .setName("John")
   .setPoints(new Number[] {5, 3, 4, 7, 2})
   .setStack("male")
);
GWT Highcharts 堆积分组柱状图 示例
package com.yiidian.helloWorld.client;


import com.google.gwt.core.client.EntryPoint;
import com.google.gwt.user.client.ui.RootPanel;
import org.moxieapps.gwt.highcharts.client.*;
import org.moxieapps.gwt.highcharts.client.labels.DataLabels;
import org.moxieapps.gwt.highcharts.client.plotOptions.ColumnPlotOptions;
import org.moxieapps.gwt.highcharts.client.plotOptions.PlotOptions;
import org.moxieapps.gwt.highcharts.client.plotOptions.SeriesPlotOptions;

public class HelloWorld implements EntryPoint {
    public void onModuleLoad() {
        final Chart chart = new Chart()
                .setType(Series.Type.COLUMN)
                .setChartTitleText("Total fruit consumption, grouped by gender")
                .setColumnPlotOptions(new ColumnPlotOptions()
                        .setStacking(PlotOptions.Stacking.NORMAL)
                );

        chart.getXAxis()
                .setCategories("Apples", "Oranges", "Pears", "Grapes", "Bananas");

        chart.getYAxis()
                .setAllowDecimals(false)
                .setMin(0)
                .setAxisTitleText("Number of fruits");

        chart.addSeries(chart.createSeries()
                .setName("John")
                .setPoints(new Number[] {5, 3, 4, 7, 2})
                .setStack("male")
        );
        chart.addSeries(chart.createSeries()
                .setName("Joe")
                .setPoints(new Number[] {3, 4, 4, 2, 5})
                .setStack("male")
        );
        chart.addSeries(chart.createSeries()
                .setName("Jane")
                .setPoints(new Number[] {2, 2, 3, 2, 1})
                .setStack("female")
        );
        chart.addSeries(chart.createSeries()
                .setName("Janet")
                .setPoints(new Number[] {3, 0, 4, 4, 3})
                .setStack("female")
        );
        RootPanel.get().add(chart);
    }
}
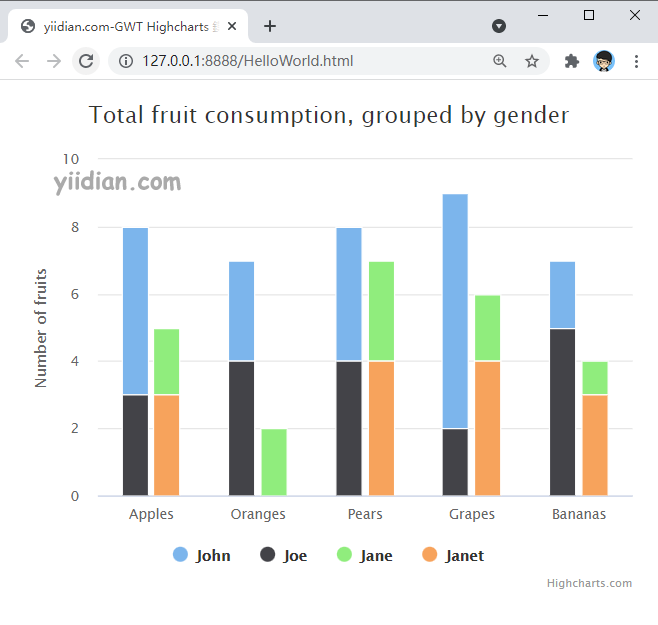
输出结果为:
热门文章
优秀文章
