GWT Highcharts 带有旋转标签的柱状图

GWT Highcharts 带有旋转标签的柱状图 介绍
我们已经在《GWT Highcharts 入门案例》一章中看到了用于绘制此图表的步骤。现在让我们考虑以下示例以进一步了解带有旋转标签的柱状图。
数据标签
dataLabels 是一个包装对象,用于处理图表中的数据标签。
以度为单位的文本旋转。请注意,由于结构更复杂,旋转数据标签上的背景、边框和填充将丢失。这默认为 0。
chart.addSeries(chart.createSeries()
   .setName("Population")
   .setPoints(new Number[] { 34.4, 21.8, 20.1, 20, 19.6, 19.5, 19.1, 18.4, 18,
      17.3, 16.8, 15, 14.7, 14.5, 13.3, 12.8, 12.4, 11.8,
      11.7, 11.2  })
   )
   .setColumnPlotOptions(new ColumnPlotOptions()
      .setDataLabels(new DataLabels()
      .setEnabled(true)
      .setRotation(-90)
      .setColor("#FFFFFF")
      .setAlign(Align.RIGHT)
      .setX(-3)
      .setY(10)
      .setFormatter(new DataLabelsFormatter() {
         @Override
         public String format(DataLabelsData dataLabelsData) {
            return NumberFormat.getFormat("0.0").format(dataLabelsData.getYAsDouble());
         }
      })
     .setStyle(new Style()
        .setFont("normal 13px Verdana, sans-serif")
     )
   )
);
GWT Highcharts 带有旋转标签的柱状图 示例
package com.yiidian.helloWorld.client;


import com.google.gwt.core.client.EntryPoint;
import com.google.gwt.i18n.client.NumberFormat;
import com.google.gwt.user.client.ui.RootPanel;
import org.moxieapps.gwt.highcharts.client.*;
import org.moxieapps.gwt.highcharts.client.labels.*;
import org.moxieapps.gwt.highcharts.client.plotOptions.ColumnPlotOptions;
import org.moxieapps.gwt.highcharts.client.plotOptions.PlotOptions;
import org.moxieapps.gwt.highcharts.client.plotOptions.SeriesPlotOptions;

public class HelloWorld implements EntryPoint {
    public void onModuleLoad() {
        final Chart chart = new Chart()
                .setType(Series.Type.COLUMN)
                .setChartTitleText("World's largest cities per 2008")
                .setMargin(50, 50, 100, 80)
                .setToolTip(new ToolTip()
                        .setFormatter(new ToolTipFormatter() {
                            @Override
                            public String format(ToolTipData toolTipData) {
                                return "<b>" + toolTipData.getXAsString() + "</b><br/>" +
                                        "Population in 2008: " +
                                        NumberFormat.getFormat("0.0").format(toolTipData.getYAsDouble()) +
                                        " millions";
                            }
                        })
                );

        chart.getXAxis()
                .setCategories("Tokyo", "Jakarta", "New York", "Seoul", "Manila", "Mumbai", "Sao Paulo",
                        "Mexico City", "Dehli", "Osaka", "Cairo", "Kolkata", "Los Angeles", "Shanghai",
                        "Moscow", "Beijing", "Buenos Aires", "Guangzhou", "Shenzhen", "Istanbul" )
                .setLabels(new XAxisLabels()
                        .setRotation(-45)
                        .setAlign(Labels.Align.RIGHT)
                        .setStyle(new Style()
                                .setFont("normal 13px Verdana, sans-serif")
                        )
                );
        chart.getYAxis()
                .setMin(0)
                .setAxisTitleText("Population (millions)");

        chart.addSeries(chart.createSeries()
                .setName("Population")
                .setPoints(new Number[] { 34.4, 21.8, 20.1, 20, 19.6, 19.5, 19.1, 18.4, 18,
                        17.3, 16.8, 15, 14.7, 14.5, 13.3, 12.8, 12.4, 11.8,
                        11.7, 11.2  })
        ).setColumnPlotOptions(new ColumnPlotOptions()
                .setDataLabels(new DataLabels()
                        .setEnabled(true)
                        .setRotation(-90)
                        .setColor("#FFFFFF")
                        .setAlign(Labels.Align.RIGHT)
                        .setX(-3)
                        .setY(10)
                        .setFormatter(new DataLabelsFormatter() {
                            @Override
                            public String format(DataLabelsData dataLabelsData) {
                                return NumberFormat.getFormat("0.0").format(dataLabelsData.getYAsDouble());
                            }
                        })
                        .setStyle(new Style()
                                .setFont("normal 13px Verdana, sans-serif")
                        )
                )
        );
        RootPanel.get().add(chart);
    }
}
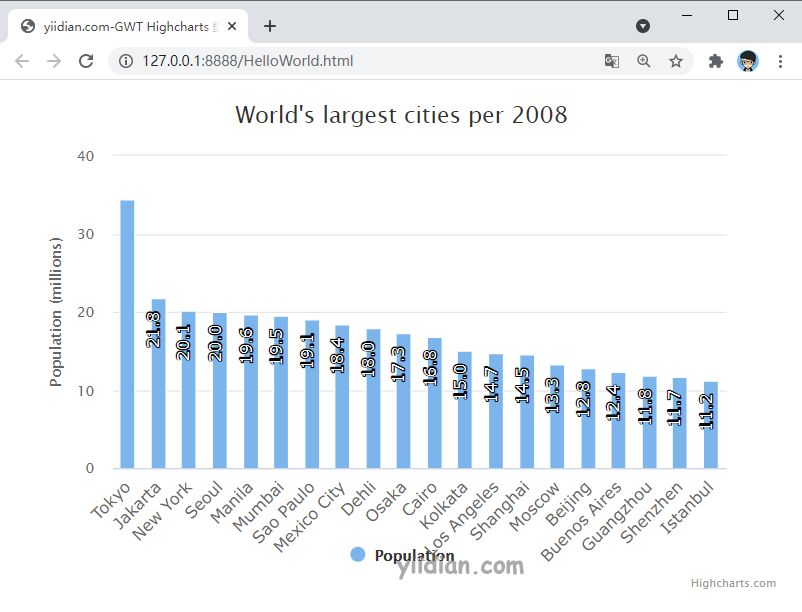
输出结果为:
热门文章
优秀文章
