GWT Highcharts 基本柱状图

GWT Highcharts 基本柱状图 介绍
我们已经在《GWT Highcharts 入门案例》一章中看到了用于绘制此图表的步骤。现在让我们考虑以下示例以进一步了解基本柱状图。
图表
将图表类型配置为基于“列”。chart.type决定图表的系列类型。此处,默认值为“line”。
chart.setType(Type.COLUMN);
GWT Highcharts 基本柱状图 示例
package com.yiidian.helloWorld.client;
import com.google.gwt.core.client.EntryPoint;
import com.google.gwt.user.client.ui.RootPanel;
import org.moxieapps.gwt.highcharts.client.*;
import org.moxieapps.gwt.highcharts.client.labels.DataLabels;
import org.moxieapps.gwt.highcharts.client.plotOptions.ColumnPlotOptions;
public class HelloWorld implements EntryPoint {
public void onModuleLoad() {
Chart chart = new Chart()
.setType(Series.Type.COLUMN)
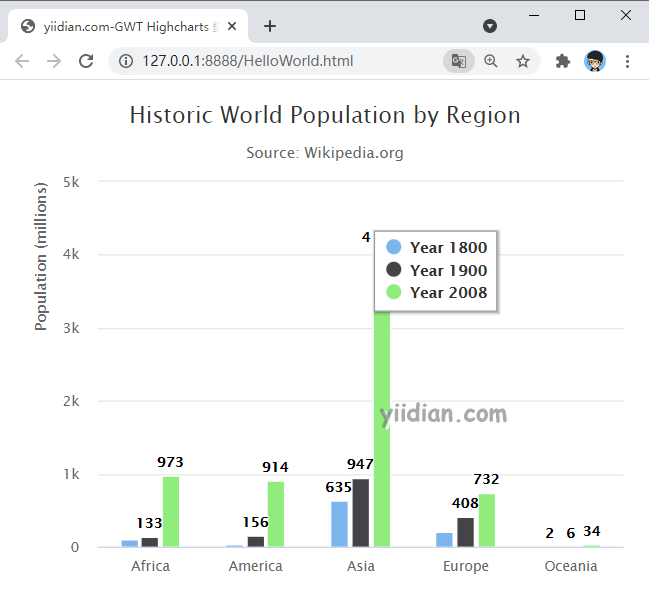
.setChartTitleText("Historic World Population by Region")
.setChartSubtitleText("Source: Wikipedia.org")
.setColumnPlotOptions(new ColumnPlotOptions()
.setDataLabels(new DataLabels()
.setEnabled(true)
)
)
.setLegend(new Legend()
.setLayout(Legend.Layout.VERTICAL)
.setAlign(Legend.Align.RIGHT)
.setVerticalAlign(Legend.VerticalAlign.TOP)
.setX(-100)
.setY(100)
.setFloating(true)
.setBorderWidth(1)
.setBackgroundColor("#FFFFFF")
.setShadow(true)
)
.setCredits(new Credits()
.setEnabled(false)
)
.setToolTip(new ToolTip()
.setFormatter(new ToolTipFormatter() {
@Override
public String format(ToolTipData toolTipData) {
return toolTipData.getSeriesName() + ": " + toolTipData.getYAsLong() +" million";
}
}));
chart.getXAxis()
.setCategories("Africa", "America", "Asia", "Europe", "Oceania");
chart.getYAxis()
.setAxisTitle(new AxisTitle()
.setText("Population (millions)")
.setAlign(AxisTitle.Align.HIGH)
);
chart.addSeries(chart.createSeries()
.setName("Year 1800")
.setPoints(new Number[] { 107, 31, 635, 203, 2 })
);
chart.addSeries(chart.createSeries()
.setName("Year 1900")
.setPoints(new Number[] { 133, 156, 947, 408, 6 })
);
chart.addSeries(chart.createSeries()
.setName("Year 2008")
.setPoints(new Number[] { 973, 914, 4054, 732, 34 })
);
RootPanel.get().add(chart);
}
}
输出结果为:
热门文章
优秀文章
