GWT Highcharts 缺值区域图

GWT Highcharts 缺值区域图 介绍
我们已经在《GWT Highcharts 入门案例》一章中看到了用于绘制此图表的步骤。现在让我们考虑以下示例以进一步了解缺值区域图。
图表
配置图表的spacingBottom为30。它表示图表底部边缘和内容(绘图区域、轴标题和标签、顶部位置的标题、副标题或图例)之间的空间。
chart.setSpacingBottom(30);
GWT Highcharts 缺值区域图 示例
package com.yiidian.helloWorld.client;
import com.google.gwt.core.client.EntryPoint;
import com.google.gwt.i18n.client.NumberFormat;
import com.google.gwt.user.client.ui.RootPanel;
import org.moxieapps.gwt.highcharts.client.*;
import org.moxieapps.gwt.highcharts.client.labels.*;
import org.moxieapps.gwt.highcharts.client.plotOptions.AreaPlotOptions;
import org.moxieapps.gwt.highcharts.client.plotOptions.Marker;
import org.moxieapps.gwt.highcharts.client.plotOptions.PlotOptions;
public class HelloWorld implements EntryPoint {
public void onModuleLoad() {
Chart chart = new Chart()
.setType(Series.Type.AREA)
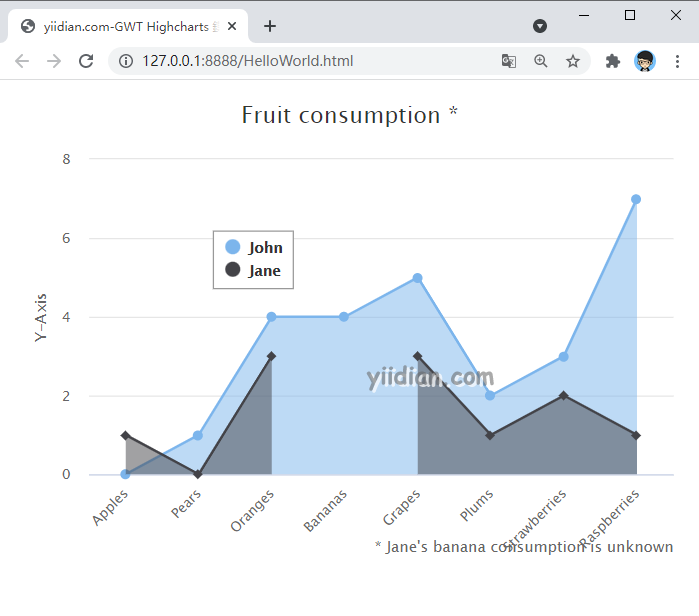
.setChartTitleText("Fruit consumption *")
.setChartSubtitle(new ChartSubtitle()
.setText("* Jane's banana consumption is unknown")
.setFloating(true)
.setAlign(ChartTitle.Align.RIGHT)
.setVerticalAlign(ChartTitle.VerticalAlign.BOTTOM)
.setY(15)
)
.setSpacingBottom(30)
.setLegend(new Legend()
.setLayout(Legend.Layout.VERTICAL)
.setAlign(Legend.Align.LEFT)
.setVerticalAlign(Legend.VerticalAlign.TOP)
.setX(150)
.setY(100)
.setFloating(true)
.setBorderWidth(1)
.setBackgroundColor("#FFFFFF")
)
.setToolTip(new ToolTip()
.setFormatter(
new ToolTipFormatter() {
public String format(ToolTipData toolTipData) {
return "<b>" + toolTipData.getSeriesName() + "</b<<br/>" +
toolTipData.getXAsString() + ": " + toolTipData.getYAsLong();
}
}
)
)
.setCredits(new Credits()
.setEnabled(false)
)
.setAreaPlotOptions(new AreaPlotOptions()
.setFillOpacity(0.5)
);
chart.getXAxis()
.setCategories(
"Apples", "Pears", "Oranges", "Bananas", "Grapes", "Plums", "Strawberries", "Raspberries"
);
chart.getYAxis()
.setAxisTitleText("Y-Axis")
.setLabels(new YAxisLabels()
.setFormatter(new AxisLabelsFormatter() {
public String format(AxisLabelsData axisLabelsData) {
return String.valueOf(axisLabelsData.getValueAsLong());
}
})
);
chart.addSeries(chart.createSeries()
.setName("John")
.setPoints(new Number[] {0, 1, 4, 4, 5, 2, 3, 7})
);
chart.addSeries(chart.createSeries()
.setName("Jane")
.setPoints(new Number[] {1, 0, 3, null, 3, 1, 2, 1})
);
RootPanel.get().add(chart);
}
}
输出结果为:
热门文章
优秀文章
