GWT Highcharts 3D散点图

GWT Highcharts 3D散点图 介绍
我们已经在《GWT Highcharts 入门案例》一章中看到了用于绘制此图表的步骤。现在让我们考虑以下示例以进一步了解3D散点图。
option3D
将散点图类型配置为基于 3D。Options3D设置启用的 3D 选项。
chart.setOptions3D(new Options3D()
   .setEnabled(true)
   .setAlpha(10)
   .setBeta(30)
   .setDepth(250)
   .setViewDistance(5)
   .setFrame(new Frame()
      .setBottom(new FramePanel()
         .setSize(1)
         .setColor(new Color(0, 0, 0, 0.02))
      )
      .setBack(new FramePanel ()
         .setSize(1)
         .setColor(new Color(0, 0, 0, 0.04))
      )
      .setSide(new FramePanel()
         .setSize(1)
         .setColor(new Color(0, 0, 0, 0.06))
      )
   )
)
GWT Highcharts 3D散点图 示例
package com.yiidian.helloWorld.client;
import com.google.gwt.core.client.EntryPoint;
import com.google.gwt.user.client.ui.RootPanel;
import org.moxieapps.gwt.highcharts.client.*;
import org.moxieapps.gwt.highcharts.client.plotOptions.*;
public class HelloWorld implements EntryPoint {
public void onModuleLoad() {
final Chart chart = new Chart()
.setMarginBottom(100)
.setMarginRight(50)
.setType(Series.Type.SCATTER)
.setOptions3D(new Options3D()
.setEnabled(true)
.setAlpha(10)
.setBeta(30)
.setDepth(250)
.setViewDistance(5)
.setFrame(new Frame()
.setBottom(new Frame.FramePanel()
.setSize(1)
.setColor(new Color(0, 0, 0, 0.02))
)
.setBack(new Frame.FramePanel()
.setSize(1)
.setColor(new Color(0, 0, 0, 0.04))
)
.setSide(new Frame.FramePanel()
.setSize(1)
.setColor(new Color(0, 0, 0, 0.06))
)
)
)
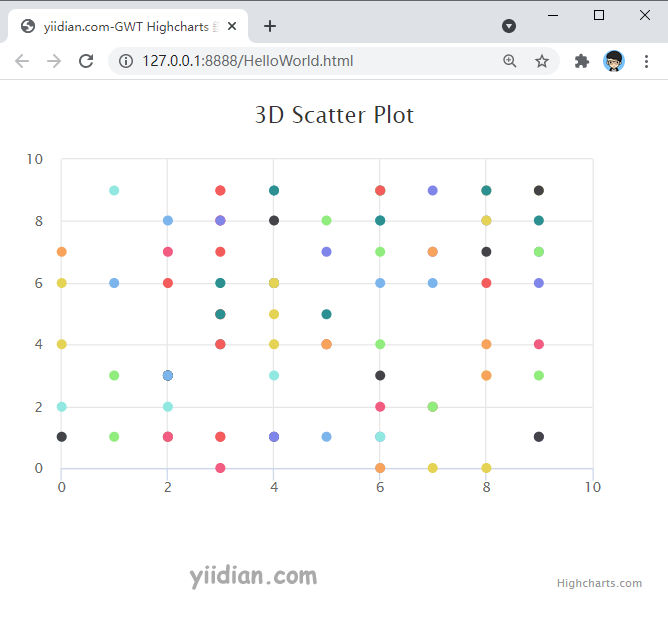
.setChartTitleText("3D Scatter Plot");
chart.getYAxis()
.setMin(0)
.setMax(10)
.setAxisTitle(null);
chart.getXAxis()
.setMin(0)
.setMax(10)
.setGridLineWidth(1);
chart.getZAxis()
.setMin(0)
.setMax(10);
chart.setLegend(new Legend()
.setEnabled(false)
);
chart.addSeries(chart.createSeries()
.setName("Reading")
.setColorByPoint(true)
.setPoints(new Number[][] {
{1, 6, 5}, {8, 7, 9}, {1, 3, 4}, {4, 6, 8}, {5, 7, 7}, {6, 9, 6},
{7, 0, 5}, {2, 3, 3}, {3, 9, 8}, {3, 6, 5}, {4, 9, 4}, {2, 3, 3},
{6, 9, 9}, {0, 7, 0}, {7, 7, 9}, {7, 2, 9}, {0, 6, 2}, {4, 6, 7},
{3, 7, 7}, {0, 1, 7}, {2, 8, 6}, {2, 3, 7}, {6, 4, 8}, {3, 5, 9},
{7, 9, 5}, {3, 1, 7}, {4, 4, 2}, {3, 6, 2}, {3, 1, 6}, {6, 8, 5},
{6, 6, 7}, {4, 1, 1}, {7, 2, 7}, {7, 7, 0}, {8, 8, 9}, {9, 4, 1},
{8, 3, 4}, {9, 8, 9}, {3, 5, 3}, {0, 2, 4}, {6, 0, 2}, {2, 1, 3},
{5, 8, 9}, {2, 1, 1}, {9, 7, 6}, {3, 0, 2}, {9, 9, 0}, {3, 4, 8},
{2, 6, 1}, {8, 9, 2}, {7, 6, 5}, {6, 3, 1}, {9, 3, 1}, {8, 9, 3},
{9, 1, 0}, {3, 8, 7}, {8, 0, 0}, {4, 9, 7}, {8, 6, 2}, {4, 3, 0},
{2, 3, 5}, {9, 1, 4}, {1, 1, 4}, {6, 0, 2}, {6, 1, 6}, {3, 8, 8},
{8, 8, 7}, {5, 5, 0}, {3, 9, 6}, {5, 4, 3}, {6, 8, 3}, {0, 1, 5},
{6, 7, 3}, {8, 3, 2}, {3, 8, 3}, {2, 1, 6}, {4, 6, 7}, {8, 9, 9},
{5, 4, 2}, {6, 1, 3}, {6, 9, 5}, {4, 8, 2}, {9, 7, 4}, {5, 4, 2},
{9, 6, 1}, {2, 7, 3}, {4, 5, 4}, {6, 8, 1}, {3, 4, 0}, {2, 2, 6},
{5, 1, 2}, {9, 9, 7}, {6, 9, 9}, {8, 4, 3}, {4, 1, 7}, {6, 2, 5},
{0, 4, 9}, {3, 5, 9}, {6, 9, 1}, {1, 9, 2}
})
);
RootPanel.get().add(chart);
}
}
输出结果为:
热门文章
优秀文章
