GWT Google Charts 表格图

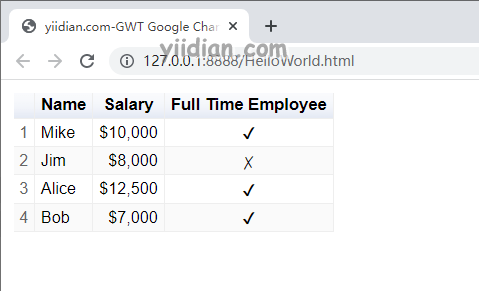
表格图表有助于呈现可以排序和分页的表格。可以使用格式字符串或直接插入 HTML 作为单元格值来设置表格单元格的格式。数值默认右对齐;布尔值显示为复选标记或十字标记。用户可以使用键盘或鼠标选择单行。列标题可用于排序。滚动期间标题行保持固定。该表触发与用户交互相对应的事件。
以下是表格图的示例。
我们已经在《GWT Google Charts 入门程序》章节中看到了用于绘制图表的基本步骤。现在,让我们看一个表格图的例子。
GWT Google Charts 表格图 配置
我们使用Table类来显示表格图。
Table chart = new Chart();
GWT Google Charts 表格图 示例
package com.yiidian.helloWorld.client;

import com.google.gwt.core.client.EntryPoint;
import com.google.gwt.user.client.ui.*;
import com.googlecode.gwt.charts.client.ChartLoader;
import com.googlecode.gwt.charts.client.ChartPackage;
import com.googlecode.gwt.charts.client.ColumnType;
import com.googlecode.gwt.charts.client.DataTable;
import com.googlecode.gwt.charts.client.corechart.ScatterChart;
import com.googlecode.gwt.charts.client.corechart.ScatterChartOptions;
import com.googlecode.gwt.charts.client.table.Table;
import com.googlecode.gwt.charts.client.table.TableOptions;

public class HelloWorld implements EntryPoint {
    private Table chart;

    private void initialize() {
        ChartLoader chartLoader = new ChartLoader(ChartPackage.TABLE);
        chartLoader.loadApi(new Runnable() {
            public void run() {
                // Create and attach the chart
                chart = new Table();
                RootPanel.get().add(chart);
                draw();
            }
        });
    }
    private void draw() {
        // Prepare the data
        DataTable dataTable = DataTable.create();
        dataTable.addColumn(ColumnType.STRING, "Name");
        dataTable.addColumn(ColumnType.NUMBER, "Salary");
        dataTable.addColumn(ColumnType.BOOLEAN, "Full Time Employee");
        dataTable.addRows(4);

        dataTable.setCell(0, 0, "Mike");
        dataTable.setCell(0, 1, 10000, "$10,000");
        dataTable.setCell(0, 2, true);
        dataTable.setCell(1, 0, "Jim");
        dataTable.setCell(1, 1, 8000, "$8,000");
        dataTable.setCell(1, 2, false);
        dataTable.setCell(2, 0, "Alice");
        dataTable.setCell(2, 1, 12500, "$12,500");
        dataTable.setCell(2, 2, true);
        dataTable.setCell(3, 0, "Bob");
        dataTable.setCell(3, 1, 7000, "$7,000");
        dataTable.setCell(3, 2, true);

        TableOptions options  = TableOptions.create();
        options.setAlternatingRowStyle(true);
        options.setShowRowNumber(true);

        // Draw the chart
        chart.draw(dataTable, options);
        chart.setWidth("600px");
        chart.setHeight("400px");
    }
    public void onModuleLoad() {
        initialize();
    }
}
输出结果为:
热门文章
优秀文章
