GWT Google Charts 基本阶梯图

以下是基本阶梯图的示例。
我们已经在《GWT Google Charts 入门程序》章节中看到了用于绘制图表的基本步骤。现在,让我们看一个基本阶梯图的例子。
GWT Google Charts 基本阶梯图 配置
我们使用ScatterChart类来显示基本阶梯图。
SteppedChart chart = new SteppedChart();
GWT Google Charts 基本阶梯图 示例
package com.yiidian.helloWorld.client;
import com.google.gwt.core.client.EntryPoint;
import com.google.gwt.user.client.ui.*;
import com.googlecode.gwt.charts.client.ChartLoader;
import com.googlecode.gwt.charts.client.ChartPackage;
import com.googlecode.gwt.charts.client.ColumnType;
import com.googlecode.gwt.charts.client.DataTable;
import com.googlecode.gwt.charts.client.corechart.SteppedAreaChart;
import com.googlecode.gwt.charts.client.corechart.SteppedAreaChartOptions;
import com.googlecode.gwt.charts.client.options.VAxis;
import com.googlecode.gwt.charts.client.treemap.TreeMap;
import com.googlecode.gwt.charts.client.treemap.TreeMapOptions;
public class HelloWorld implements EntryPoint {
private SteppedAreaChart chart;
private void initialize() {
ChartLoader chartLoader = new ChartLoader(ChartPackage.CORECHART);
chartLoader.loadApi(new Runnable() {
public void run() {
// Create and attach the chart
chart = new SteppedAreaChart();
RootPanel.get().add(chart);
draw();
}
});
}
private void draw() {
// Prepare the data
DataTable data = DataTable.create();
data.addColumn(ColumnType.STRING, "Director (Year)");
data.addColumn(ColumnType.NUMBER, "Rotten Tomatoes");
data.addColumn(ColumnType.NUMBER, "IMDB");
data.addRow("Alfred Hitchcock (1935)", 8.4, 7.9);
data.addRow("Ralph Thomas (1959)", 6.9, 6.5);
data.addRow("Don Sharp (1978)", 6.5, 6.4);
data.addRow("James Hawes (2008)", 4.4, 6.2);
SteppedAreaChartOptions options = SteppedAreaChartOptions.create();
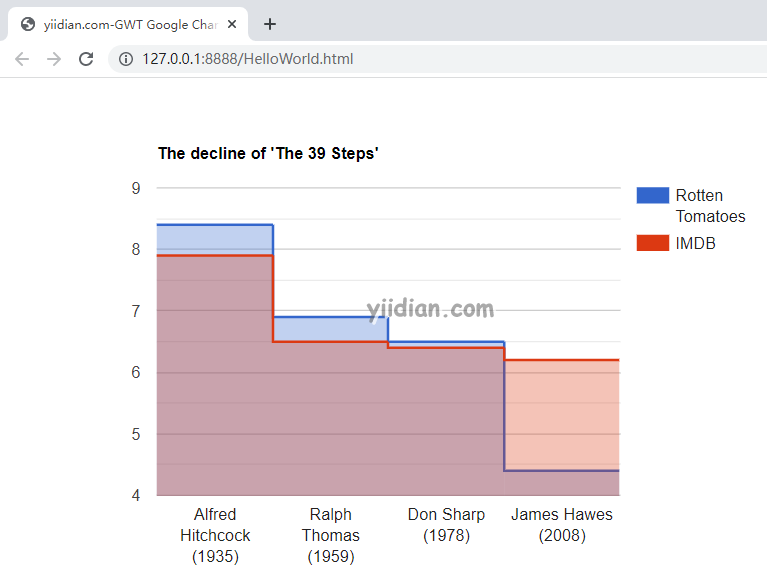
options.setTitle("The decline of 'The 39 Steps'");
VAxis vAxis = VAxis.create();
vAxis.setTitle("Accumulated Rating");
// Draw the chart
chart.draw(data, options);
chart.setWidth("600px");
chart.setHeight("400px");
}
public void onModuleLoad() {
initialize();
}
}
输出结果为:
热门文章
优秀文章
