GWT Google Charts 3D饼图

以下是3D饼图的示例。
我们已经在《GWT Google Charts 入门程序》章节中看到了用于绘制图表的基本步骤。现在,让我们看一个3D饼图的例子。
GWT Google Charts 3D饼图 配置
我们使用setIs3D方法来显示3D饼图。
options.setIs3D(true);
GWT Google Charts 3D饼图 示例
package com.yiidian.helloWorld.client;
import com.google.gwt.core.client.EntryPoint;
import com.google.gwt.user.client.ui.*;
import com.googlecode.gwt.charts.client.ChartLoader;
import com.googlecode.gwt.charts.client.ChartPackage;
import com.googlecode.gwt.charts.client.ColumnType;
import com.googlecode.gwt.charts.client.DataTable;
import com.googlecode.gwt.charts.client.corechart.*;
public class HelloWorld implements EntryPoint {
private PieChart chart;
private void initialize() {
ChartLoader chartLoader = new ChartLoader(ChartPackage.CORECHART);
chartLoader.loadApi(new Runnable() {
public void run() {
// Create and attach the chart
chart = new PieChart();
RootPanel.get().add(chart);
draw();
}
});
}
private void draw() {
// Prepare the data
DataTable data = DataTable.create();
data.addColumn(ColumnType.STRING, "Browser");
data.addColumn(ColumnType.NUMBER, "Percentage");
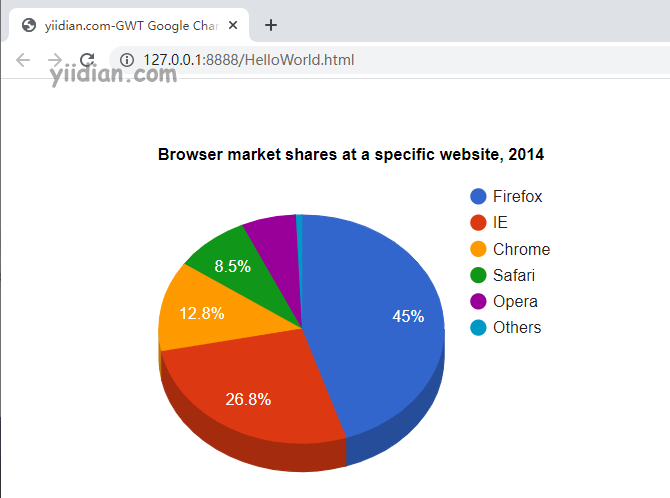
data.addRow("Firefox", 45.0);
data.addRow("IE", 26.8);
data.addRow("Chrome", 12.8);
data.addRow("Safari", 8.5);
data.addRow("Opera", 6.2);
data.addRow("Others", 0.7);
PieChartOptions options = PieChartOptions.create();
options.setTitle("Browser market shares at a specific website, 2014");
options.setIs3D(true);
// Draw the chart
chart.draw(data,options);
chart.setWidth("600px");
chart.setHeight("400px");
}
public void onModuleLoad() {
initialize();
}
}
输出结果为:
热门文章
优秀文章
