GWT Google Charts 差异条形图

以下是差异条形图的示例。
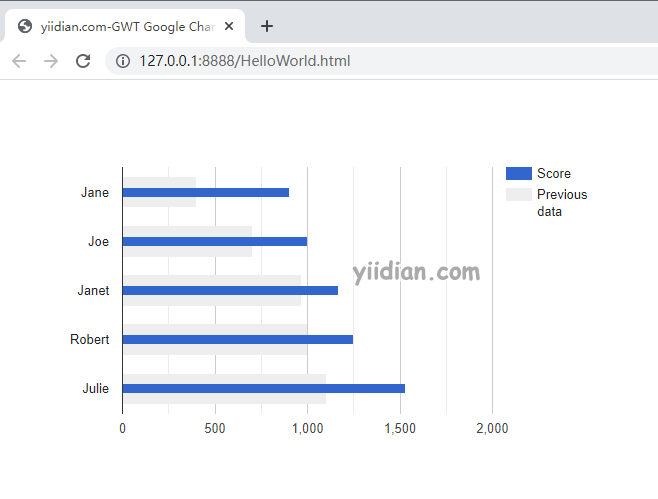
我们已经在《GWT Google Charts 入门程序》章节中看到了用于绘制图表的基本步骤。现在,让我们看一个差异条形图的例子。
GWT Google Charts 差异条形图 配置
我们使用BarChart类来显示差异条形图。
// bar chart
BarChart chart = new BarChart();
GWT Google Charts 基本区域图 示例
package com.yiidian.helloWorld.client;

import com.google.gwt.core.client.EntryPoint;
import com.google.gwt.user.client.ui.*;
import com.google.gwt.user.client.rpc.AsyncCallback;
import com.google.gwt.user.client.DOM;
import com.google.gwt.event.dom.client.ClickHandler;
import com.google.gwt.event.dom.client.ClickEvent;
import com.googlecode.gwt.charts.client.ChartLoader;
import com.googlecode.gwt.charts.client.ChartPackage;
import com.googlecode.gwt.charts.client.ColumnType;
import com.googlecode.gwt.charts.client.DataTable;
import com.googlecode.gwt.charts.client.corechart.*;
import com.googlecode.gwt.charts.client.options.HAxis;
import com.googlecode.gwt.charts.client.options.VAxis;

public class HelloWorld implements EntryPoint {
    private BarChart chart;

    private void initialize() {
        ChartLoader chartLoader = new ChartLoader(ChartPackage.CORECHART);
        chartLoader.loadApi(new Runnable() {
            public void run() {
                // Create and attach the chart
                chart = new BarChart();
                RootPanel.get().add(chart);
                draw();
            }
        });
    }
    private void draw() {
        DataTable current = DataTable.create();
        current.addColumn(ColumnType.STRING, "Name");
        current.addColumn(ColumnType.NUMBER, "Score");
        current.addRow("Jane", 900);
        current.addRow("Joe", 1000);
        current.addRow("Janet", 1170);
        current.addRow("Robert", 1250);
        current.addRow("Julie", 1530);

        // Prepare the data
        DataTable older = DataTable.create();
        older.addColumn(ColumnType.STRING, "Name");
        older.addColumn(ColumnType.NUMBER, "Score");

        older.addRow("Jane", 400);
        older.addRow("Joe", 700);
        older.addRow("Janet", 970);
        older.addRow("Robert", 1000);
        older.addRow("Julie", 1100);

        // Draw the chart
        chart.draw(chart.computeDiff(older, current));
        chart.setWidth("600px");
        chart.setHeight("400px");
    }
    public void onModuleLoad() {
        initialize();
    }
}
输出结果为:
热门文章
优秀文章
