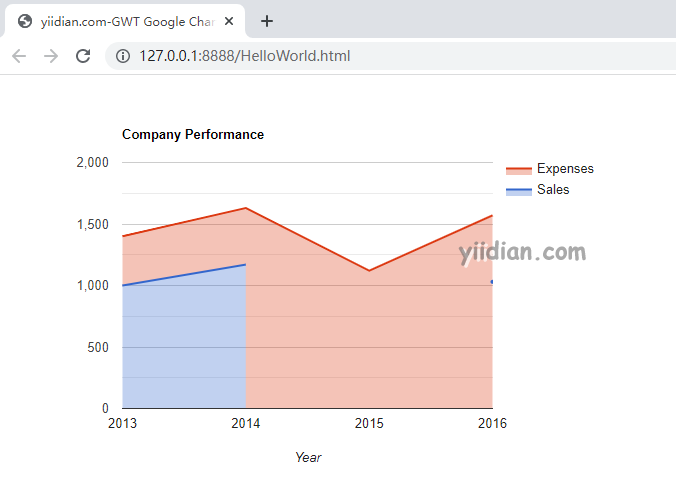
GWT Google Charts 缺值区域图

以下是缺值区域图的示例。
我们已经在《GWT Google Charts 入门程序》章节中看到了用于绘制图表的基本步骤。现在,让我们看一个缺值区域图的例子。
GWT Google Charts 缺值区域图 配置
我们使用AreaChart类来显示缺值区域图。
// area chart
AreaChart chart = new AreaChart();
GWT Google Charts 缺值区域图 示例
package com.yiidian.helloWorld.client;

import com.google.gwt.core.client.EntryPoint;
import com.google.gwt.user.client.ui.*;
import com.google.gwt.user.client.rpc.AsyncCallback;
import com.google.gwt.user.client.DOM;
import com.google.gwt.event.dom.client.ClickHandler;
import com.google.gwt.event.dom.client.ClickEvent;
import com.googlecode.gwt.charts.client.ChartLoader;
import com.googlecode.gwt.charts.client.ChartPackage;
import com.googlecode.gwt.charts.client.ColumnType;
import com.googlecode.gwt.charts.client.DataTable;
import com.googlecode.gwt.charts.client.corechart.AreaChart;
import com.googlecode.gwt.charts.client.corechart.AreaChartOptions;
import com.googlecode.gwt.charts.client.corechart.PieChart;
import com.googlecode.gwt.charts.client.options.HAxis;
import com.googlecode.gwt.charts.client.options.VAxis;

public class HelloWorld implements EntryPoint {
    private AreaChart chart;

    private void initialize() {
        ChartLoader chartLoader = new ChartLoader(ChartPackage.CORECHART);
        chartLoader.loadApi(new Runnable() {
            public void run() {
                // Create and attach the chart
                chart = new AreaChart();
                RootPanel.get().add(chart);
                draw();
            }
        });
    }
    private void draw() {
        // Prepare the data
        DataTable data = DataTable.create();
        data.addColumn(ColumnType.STRING, "Year");
        data.addColumn(ColumnType.NUMBER, "Sales");
        data.addColumn(ColumnType.NUMBER, "Expenses");

        data.addRow("2013", 1000, 400);
        data.addRow("2014", 1170, 460);
        data.addRow("2015", null, 1120);
        data.addRow("2016", 1030, 540);

        // Set options
        AreaChartOptions options = AreaChartOptions.create();
        options.setTitle("Company Performance");
        options.setIsStacked(true);
        options.setHAxis(HAxis.create("Year"));
        VAxis vAxis = VAxis.create();
        vAxis.setMinValue(0);

        options.setVAxis(vAxis);

        // Draw the chart
        chart.draw(data,options);
        chart.setWidth("600px");
        chart.setHeight("400px");
    }
    public void onModuleLoad() {
        initialize();
    }
}
输出结果为:
热门文章
优秀文章
